Physics Essay 3.10 Spring, 2012
Changing Acceleration
When acceleration changes what effect does it have on motion?
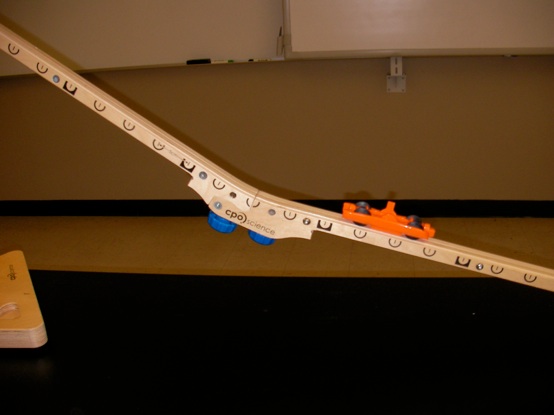
In the two-part ramp lab, you observed a situation in which the acceleration of an object changed. The change occurred because the two parts of the ramp the car was rolling down had different slopes.

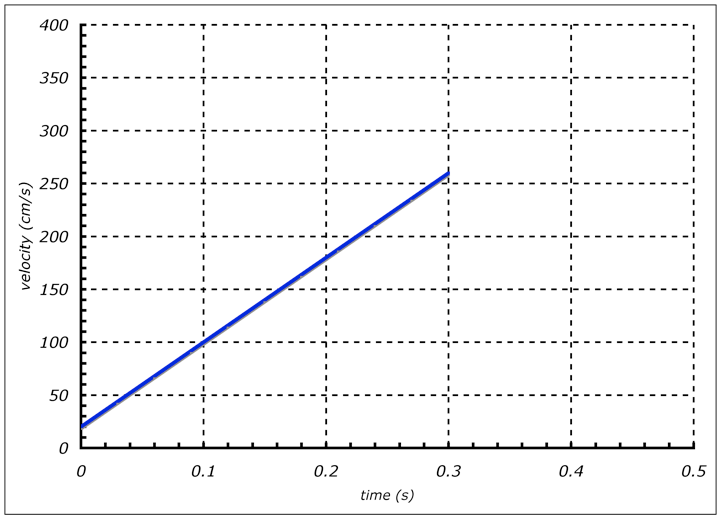
The velocity of the car increases uniformly over the upper part of the ramp. This means the acceleration of the car is constant over the upper ramp (remember the slope of the line on the v-t graph IS the acceleration of the object). Constant acceleration, as mentioned before, means the velocity of the object is changing by the same amount each second (or each 1/10th of a second).
To confirm these graphs, let’s look at the actual measurements from the upper ramp.
Figure 2, The x-t graph for the upper part of the two part ramp is shown above.
Figure 3, The v-t graph for the upper part of the two part ramp is shown above.
Figure 1, The car rolls down a steep ramp, then down a less steep ramp.
As the car rolls down the ramp, what happens to its velocity? As the car moves from the steep to the more shallow ramp, what happens to its velocity? How does the acceleration of the car change as it moves from the more steep to the less steep part of the ramp?
Let’s first look at the x-t and v-t graphs for the upper (steep) part of the ramp.
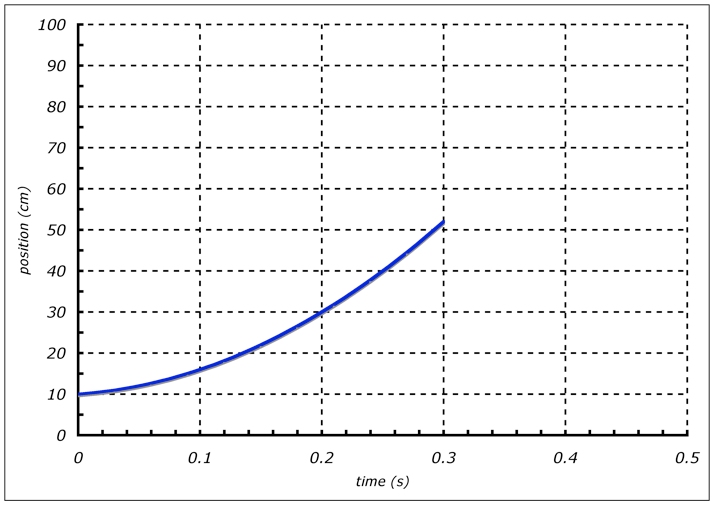
Since the car speeds up, the slope of the line increases as time passes (remember the slope of an x-t graph IS the velocity of the object). The slope at t=0 is not zero because the car is already moving when it enters the first gate. At t=0.3s, the car moves to the less steep part of the ramp (data not shown on graph yet).
What does the v-t graph for the upper part of the ramp look like?
Upper Ramp Data
Gate-A Gate-B AB-time = 0.3004 seconds
A-time = 0.2513 B-time = 0.0192
wing distance = 5 cm wing distance = 5 cm
Calculate the Gate-A velocity, Gate-B velocity, and acceleration on the upper ramp, then click here to see the answers.
Now that you have done the calculations (and used them to confirm the graphs above), let’s look at the lower (more shallow) part of the ramp. As the car moves onto the lower part of the ramp, will it continue to speed up, start to slow down, or move with constant velocity?
To answer the question above, let’s think about the direction of the force on the car and the direction of the resulting acceleration.
When the car is on the upper part of the ramp, the combined forces of the ramp and gravity push it down the ramp, making it speed up! When the car moves to the lower part of the ramp, are there still similar forces on the car? If so, what direction is the resulting force in?
If the force on the car (on the lower part of the ramp) is in the same direction as the car’s velocity, what must happen? It MUST speed up!
If the above is true, what will the continuations of the x-t and v-t graphs look like?
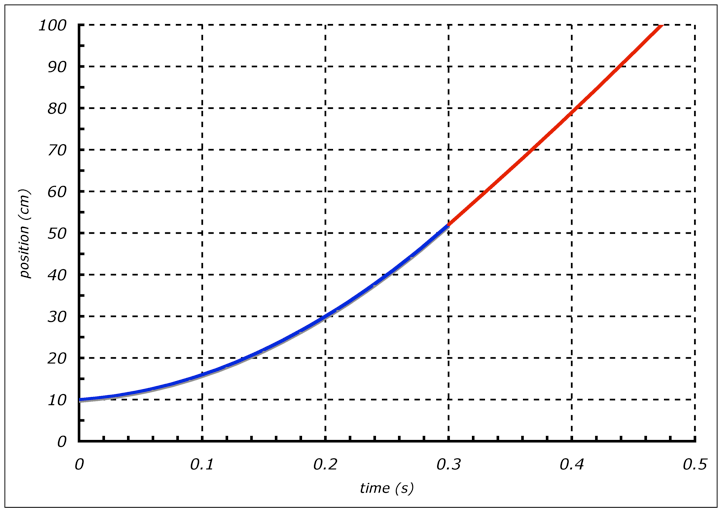
As the car continues to move down the lower ramp, it should continue to speed up. As the car speeds up, the velocity increases, meaning the curve on the x-t graph should continue to grow steeper (put a ruler to the screen and carefully check to see if the line steepens).
What should the v-t graph look like for the continued motion?
Figure 5, The p-t graph for the continued motion along the lower ramp is shown above. Notice how there is less curvature for the lower ramp plot (red line).
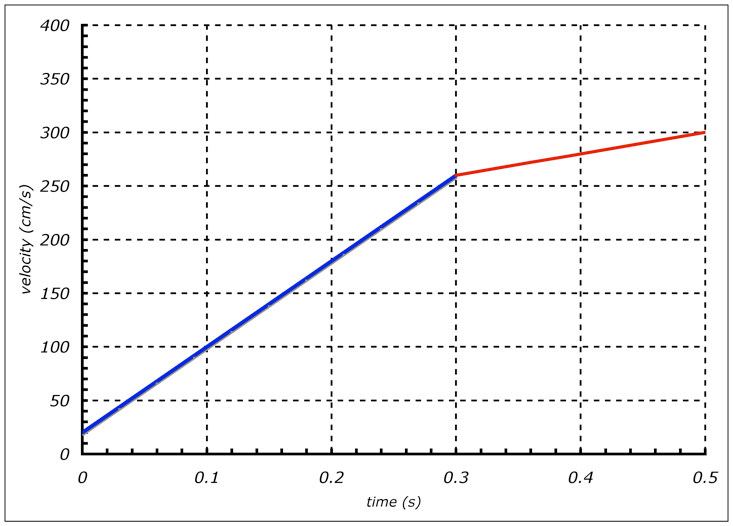
Figure 6, The v-t graph for the continued motion along the lower ramp is shown above.
Again, as the car continues to move down the lower ramp, it should continue to speed up. But think about the force on the car, while it is traveling the lower ramp. This force is in the same direction as the velocity, but the amount of force applied to the car on the lower ramp is less than the amount of force that was applied to the car on the upper ramp, because the lower ramp is at a lower angle than the higher ramp. Therefore, the car should continue to speed up, but by a smaller amount per second. In other words, the acceleration on the lower ramp should still be present (and positive), but it should be less acceleration. Since acceleration IS the slope in a v-t graph, the slope of the v-t graph becomes less steep!
Notice in Figure 6, the velocity of the car continues to increase as the car moves onto the lower ramp.
Let’s look at actual data from the experiment to confirm this.
Lower Ramp Data
Gate-A Gate-B AB-time = 0.1952 seconds
A-time = 0.0185 B-time = 0.0169
wing distance = 5 cm wing distance = 5 cm
Click here to view the answers.
Once you have confirmed the calculations using the data above, you can compare your answers to the graph. You should be able to confirm that the graphs are correct!
It is important to remember that when acceleration decreases, but remain positive, the car is STILL accelerating, so it is still increasing its velocity.
Copyright © 2009-2012, by Marcus Milling
edited by Julia Pian
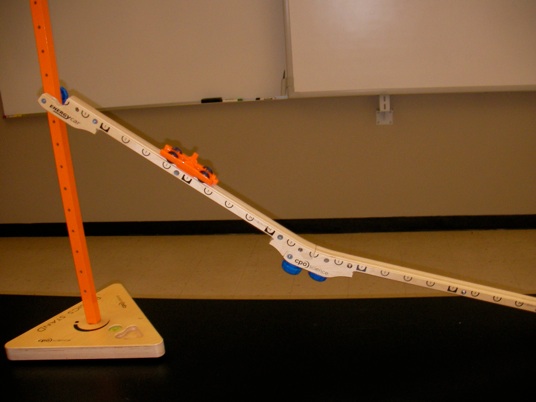
Figure 4, The direction of the force, acceleration, and velocity vectors for the car are shown above.


F
v


F and a
v


